Work

Jaeger as-a-Service
To automate the process of distributed tracing using the Jaeger distributed tracing framework and make it a Managed Service.
Aim: To automate the process of distributed tracing using the Jaeger distributed tracing framework and make it a Managed service.
Distributed tracing can be defined as different methods used to profile, monitor, and observe requests as they propagate through different services in microservice-based applications. It is useful for pinpointing failure and finding the causes of poor performance in applications. As it transmits from service to service, each service adds some information to the trace such as request arrival time for a service, time to execute a request in service, etc. Using this information it is possible to create a picture of the entire request execution path (trace) for an end-to-end request.
The Jaeger distributed tracing framework keeps traces of all the services executed in an application that follow a request path through various microservices. Since we have a trace of all services we get a full picture to identify the root cause of a failure in the application. It is also used distributed context propagation which lets us connect data from different components together to create a complete end to end trace.
In order to implement distributed tracing, it requires the developer to inject the tracer through each service when different requests are executed. Therefore, the project aims to separate the tracing logic and the application logic in order to make it run as a service. The concepts of Sidecar and Pods in Kubernetes are used.
Detached the client-library implementation of Jaeger into a sidecar proxy separate from the application container inside a Pod. The proxy determines if the packet is originating from the service or is received from other services. Accordingly, Jaeger tracing spans are started and ended by the proxy. Thus, all the Jaeger logic lives in the sidecar, oblivious to the application container. This also fits well into the current cloud-native service mesh pattern. It is also easy to maintain and roll out updates to tracing logic or even swap out tracing libraries within proxies.

Hate Speech Detection in Social Media
Developed a multi-class classifier to efficiently identify hate speech on social media and to reduce misclassification of hate speech due to the presence of offensive language.
Aim: To develop a multi-class classifier model to efficiently determine hate speech in social media posts.
On different social media platforms, different posts are misclassified as hate speech just due to the presence of offensive language. Therefore the project aims to reduce the misclassification of hate speech due to the presence of offensive language.
The dataset used for this task is the Davidson hate speech and offensive language dataset. It consists of about 25k tweets collected from different users and the different attributes are:
- count = no. of CrowdFlower users who coded each tweet (min - 3, max up to 9).
- hate_speech = no. of CF users that classified tweets to be hate speech.
- offensive_language = no. of CF users that classified tweets to be offensive.
- neither = no. of CF users that classified tweets to be neither offensive nor non-offensive.
- class = class label for majority of CF users. 0 - hate speech 1 - offensive language 2 - neither
Some preprocessing tasks are performed on the tweets in order to bring them into a standard format. The different data preprocessing steps are as follows:
- Remove Twitter Handles (@...)
- Remove URLs (https...)
- Remove extra spaces
- Lowercase the tweet
- Remove special characters
- Stemming
- Tokenization
- Stopword Removal
In order to better identify hate speech, features are generated for each tweet by creating unigram, bigram, trigram features each weighted by its TF-IDF. Additionally, in order to capture the syntactic structure sequences of unigram, bigram, and trigram POS tags weighted by their TF-IDF are created.
The different classifier models implemented are Support Vector Machine (SVM), L1 Logistic Regression, Random Forest, and Naive Bayes.
The different evaluation metrics used to evaluate the performance of the models are confusion matrix, accuracy, precision score, recall score, f1-score, and ROC-AUC curves.
The results show that the approach used in the project reduces the misclassification of posts as hate speech due to the presence of offensive language.

Memories
A social media application built on MERN stack that allows users to post interesting events that happen in their lives as well as like other user’s memories on their wall.
A social media application built on MERN stack that allows users to post interesting events that happen in their lives as well as like other user’s memories on their wall.
Allows users to sign in and create their own memories as well as like other user’s memories on their wall. Implemented user authentication using Google 0Auth as well as JWT.
Technical Stack: React JS, Node JS, MongoDB, Express JS, Material UI, HTML, CSS, JWT, Google 0Auth, Heroku
Data Analysis and Mining - Drug Consumption Dataset
Built a multi-layer perceptron to classify image using keras and tensorflow.
Drug Consumption Dataset Link: https://archive.ics.uci.edu/ml/datasets/Drug+consumption+%28quantified%29
Programming Language Used: R
The main objective of the project is to perform analysis on the dataset and gain insight into the factors which can influence a person to consume drugs.
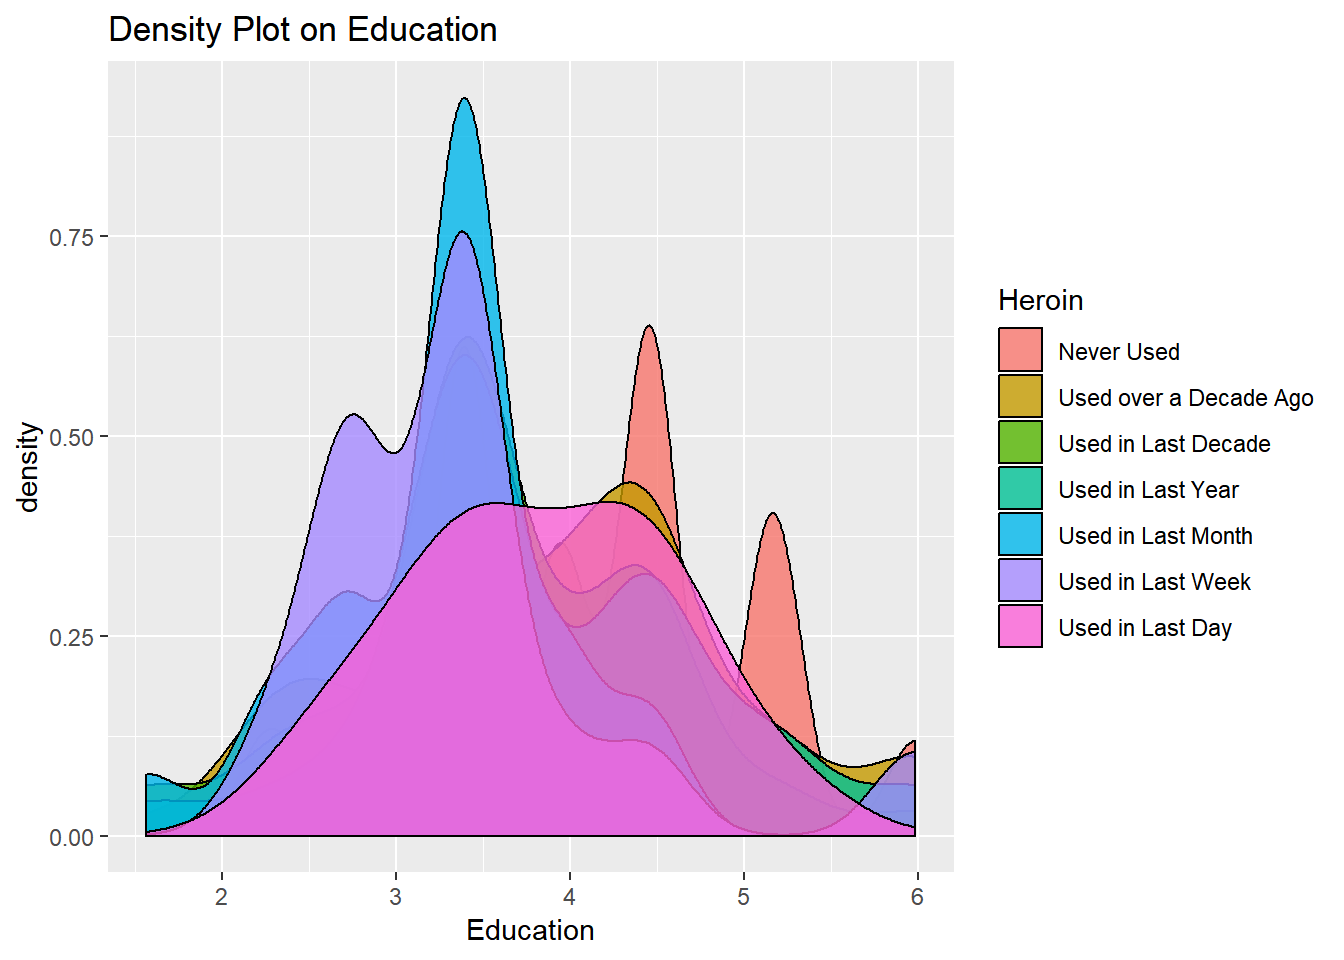
The dataset contains records for 1885 respondents. For each respondent, 12 attributes are known: personality measurements which include (neuroticism, extraversion, openness to experience, agreeableness, conscientiousness, impulsivity, sensation seeking), age, gender, level of education, country of residence, and ethnicity. For each drug the consumption of drug by the user is mentioned which is broadly categorized into the following - never used the drug, used it over a decade ago, or in the last decade, year, month, week, or day.
The data mining technique used is Classification.
Naïve Bayes Classifier is used to perform the classification.
This technique is best suited for the classification of the dataset as all the attributes which determine the drug consumption are independent of each other and the drug consumption is dependent on the probabilities of individual attributes. ( Age, Gender, Education, Neuroticism, Extraversion, Openness, Agreeableness, Conscientiousness, Impulsiveness, and Sensation).
The different activities performed in the project are as follows :
- Operations on Dataset – Decoding the data values, Initial visualization to obtain insight on attributes of data.
- Understand each attribute and its values.
- Transformation of the dataset – Scaling of the dataset, Cross-validation of data (Data Partitioning)
- Implementing Naïve Baye’s classifier on the data set and prepare visual aids for the results of data mining.
To know in detail description of the project, have a look at the report given: Data Analysis-Drug Consumption Dataset.pdf
To know the source code, have a look at the R file given: analysis.R

Subreddit Classifier
Constructed a machine learning model which predicts the subreddit for a given unlabelled post.
The main objective of this project is to build a classifier model that can predict from which subreddit an unlabelled post comes from.
The classification can be performed on any number of subreddits for any number of records.
For the given project the subreddits chosen are Computer Science, Data Science, and GRE. For each given subreddit 500 latest posts are fetched.
The task of collecting the posts is done using the PRAW API.
The data is split into three different parts - 50%, 25%, 25% as training, development, and testing.
Used sci-kit learn and nltk tools to transform the text and subreddit fields of each post into sci-kit learn feature vectors and labels.
Feature extraction such as stemming, lemming, removal of stop words performed using nltk library.
Created a bag of words using TF-ID vectorization.
Implemented the Random Forest and Support Vector Machine.
For Data Visualization, word clouds of each subreddit data are created.
In order to test the performance, different performance parameters such as ROC Curve, Confusion Matrix, Accuracy Score, Classification Report, and Precision & Recall models are implemented.
Observation:
Classification is more precise when the subreddits are unrelated to each other. (i.e they are more different). The number of records also affects performance. The accuracy is low when the subreddits are closely related to each other and less number of records are taken into consideration. The more data you download, the better your performance will be.
Programming Language Used: Python

IMDb Movie Prediction
Used Java for data processing from relational as well as non-relational databases. Implemented a Naive Bayes classifier to predict movie ratings.
Using JDBC, connected and queried relational (MySQL) as well as NoSQL (MongoDB, Neo4j) databases, to implement extract, transform and load operations on the data at the backend using Java instead of using database GUIs.
Implemented the Naïve Bayes classifier using Weka to predict movie ratings and obtained an accuracy of 89%.
Technical Stack: Java, MySQL, MongoDB, Neo4j, SQL, Cypher, Naïve Bayes Classifier, Weka
ANN - Image Recognition
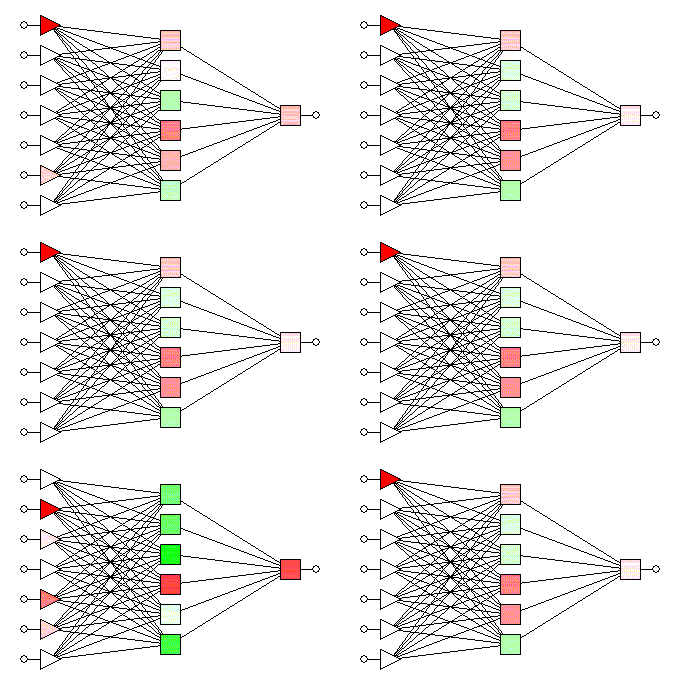
Built a multi-layer perceptron to classify image using keras and tensorflow.
Aim: To built a multilayer perceptron to recognize images and classify them into their respective categories.
The CIFAR-10 dataset is used for the project. The dataset consists of 6000 images each belonging to 10 classes. It consists of 50000 training images and 1000 test images. The images belong to 10 classes viz. airplane, automobile, bird, cat, deer, dog, frog, horse, ship, and truck.
Dataset Link: https://www.cs.toronto.edu/~kriz/cifar.html
The neural network is defined using the 'Keras' library in Python. In order to better understand the task of image recognition, the project consists of 3 different feed-forward neural network models with different configurations.
The first model consists of 3 input layers with the first layer consisting of 128 nodes, the second layer consisting of 64 nodes, and the third layer consisting of 16 nodes. All the input layers use the 'relu' activation function. The model consists of 1 output layer of 10 nodes with each node denoting each of the 10 classes of the images in the dataset. The output layer uses the 'softmax' activation function to output the probability of the prediction for classes.
The second model consists of a dropout layer added before the first input layer and has a dropout rate of 20%. The 3 input layers and 1 output layer are in the same configuration as the first model.
The third model consists of a dropout layer added before the first input layer and has a dropout rate of 20%. Additionally, it also consists of a second dropout layer added after the first hidden layer and has a dropout rate of 25%. The 3 input layers and 1 output layer are in the same configuration as the first model.
Using these three models the models are fit on the training dataset and predictions are made on the test data to predict the class of each image.
House Price Prediction
Developed a model to predict the house prices in Boston using Multi-variable Regression.
Aim: To determine the price of a house in a region by taking different factors into consideration using the technique of Multivariable Linear Regression.
The dataset used for the task house price prediction is the Boston House Prices dataset. The dataset consists of 506 records with about 13 different characteristics. The different attributes are the average number of rooms per dwelling, property tax, pupil-teacher ratio, etc. The aim is to predict the price of purchasing a house in Boston based on different attributes.
Boston House Price Dataset Link: https://www.cs.toronto.edu/~delve/data/boston/bostonDetail.html
In order to determine the price of houses, understanding the different factors that affect the decision is important. The project initially begins with visualizing the different attributes. Understanding the correlation between different attributes is also important to get a better idea of the dependency of different attributes on each other. The project takes a dive into exploring and visualizing the attributes.
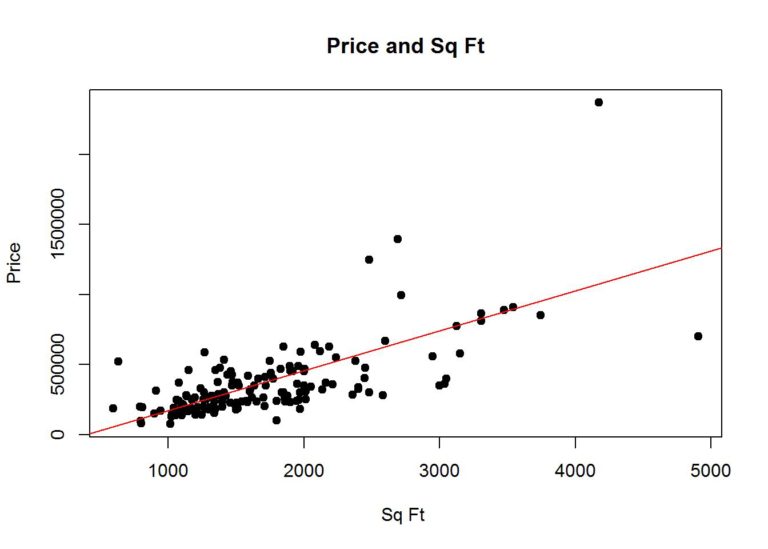
The dataset is split in a ratio of 80:20 to form the training and testing dataset respectively. The regression model is fitted on the training data and the prediction is made on the test data.
The project plots the results of the prediction to visualize how the model performed.
Email Spam Filter
Developed a classifier to filter spam emails from legitimate emails by implementing Naïve Bayes Classifier.
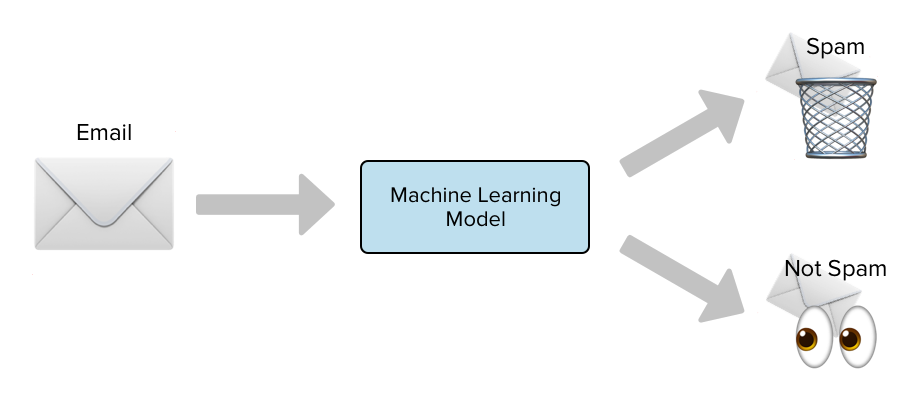
Aim: To determine whether a given email is a legitimate email (ham) or a spam email.
A classifier model is developed using the Naive Bayes classifier which determines whether a given email is a legitimate email or not.
The main motivation behind the project was to understand how exactly different email providers filter out spam emails and make an attempt to develop a model to perform the classification more efficiently.
Since the emails that we receive are unstructured, the first important step is to perform some data preprocessing. Cleaning the data is important as it will remove useless information from the text which doesn't help the classifier model in deciding whether an email is a spam or not. Since emails also consist of images, this project ignores them for now but can be considered as future work.
The different preprocessing tasks can be listed as follows:
- Convert the text to lowercase
- Remove punctuations and any other special characters
- Remove unwanted HTML tags and URL references - done using BeautifulSoup
- Remove stop words from the text
- Stemming, Lemmatization, and Tokenization of words in the email body.
If we happen to observe the spam emails that we get every day, there are specific patterns that are to be seen in the body of the spam mails. Spam emails tend to have a lot of spam words, referral URLs, fake website links, etc. The vocabulary of words used in the email is one of the key things that help to make a decision whether an email is a spam or not.
A dictionary of legitimate words is used and every email after the preprocessing tasks are passed through the dictionary and a certain threshold is used to determine the ratio of spam words to non-spam words in an email and a decision is made to classify it as spam or legitimate.
Generate the features for each email using the Count Vectorizer. The dataset was split in a ratio of 80%:20% into training and testing datasets respectively. The Naive Bayes model was trained on the trained data.
The prediction about an email being spam or not was made on the test dataset and the Naive Bayes classifier achieved an accuracy of about 95%.
Task Manager
Constructed a REST API that keeps track of user tasks using Node.js and MongoDB.
Aim: To learn and understand how to use the concept of Representational state transfer(REST) and develop a task manager application.
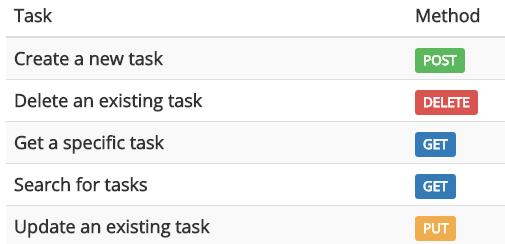
A task manager is built that will help users to manage their tasks. The operations of Create, Read, Update, and Delete are done using REST API.
The tasks are specific to each individual user. The backend database used is MongoDB and the code is written in Node.js.
The task manager is also integrated with SendGrid, which helps to send out emails to welcome users whenever a new user is created.
Used Postman to request and perform the operations of adding, deleting, and editing the tasks for different users. The user authentication is done with the help of JSON Web Tokens.
